Demand profile
Review kW, kvar and power factor across representative shifts, process states and light-load periods rather than choosing from one monthly average.

A measurement-led local APFC pathway that explains the data needed to assess reactive-power correction without publishing an unsupported rating, saving claim or universal product recommendation.
Answer first
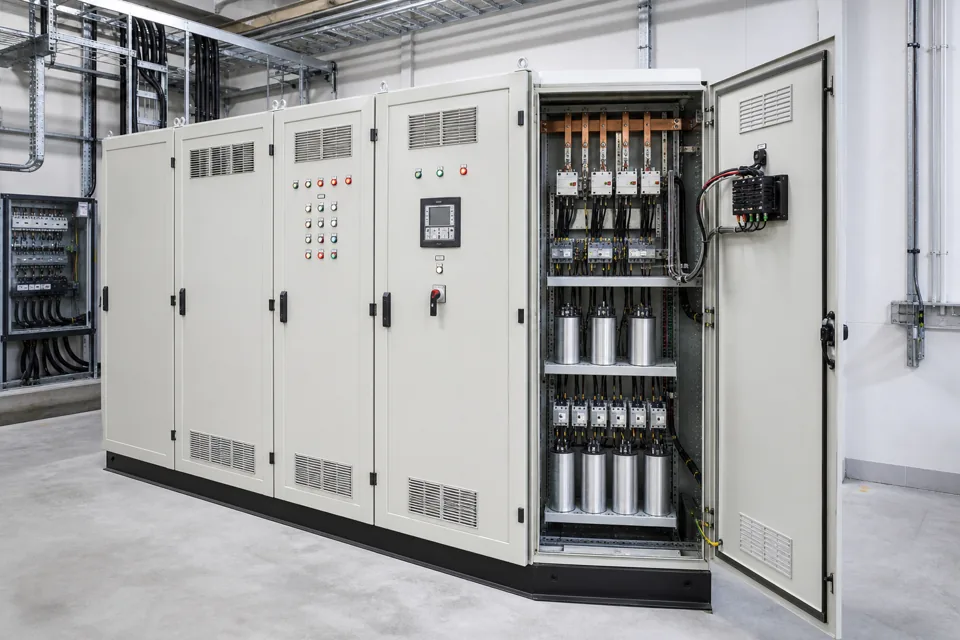
An APFC panel for an Ahilyanagar installation should be reviewed from representative active and reactive demand, power-factor behaviour, transformer and feeder context, harmonics, existing correction equipment and switching duty. A monthly bill can flag the question but cannot safely define the complete bank.
Automatic power-factor correction is not a city-standard product rating. The suitable kvar range, number and size of steps, switching method, detuning decision and protection context depend on the measured installation. An average power-factor value can hide light-load leading conditions or short repetitive demand changes.
The local page therefore brings together the bill, load profile, single-line diagram, transformer information, non-linear loads and condition of any existing capacitor bank. The objective is to determine what needs measurement or confirmation before a project-specific APFC proposal is prepared.
Decision model
Review kW, kvar and power factor across representative shifts, process states and light-load periods rather than choosing from one monthly average.
Relate the speed and frequency of reactive-load changes to contactor steps, thyristor-switched steps or another dynamic correction function.
Identify drives, rectifiers, UPS systems, welders and measured spectra before deciding whether a conventional or detuned capacitor architecture is suitable.
Mark where correction will connect and which upstream current, demand or power-factor condition it is expected to influence and verify.
A conceptual technical view of the evidence and functional boundary; final project values follow approved engineering.

Final ratings, protection, earthing, settings and interlocks follow approved project engineering.
Open full-size SVGPrepare the review
Begin with whatever is available and label unknowns. A missing input is safer as a visible verification action than as a silent design assumption.
Recent electricity bills and any interval trend of active power, reactive power and power factor.
Single-line diagram showing the transformer, main bus, major feeders and intended correction location.
Transformer rating and impedance when available, system voltage, frequency and relevant upstream protection.
Major inductive and non-linear loads, operating combinations, duty cycles and rapid repetitive events.
Harmonic measurements with location, time and operating state, or a clear list of power-electronic loads when measurements are unavailable.
Existing capacitor bank stage ratings, controller, switching devices, reactors, alarms and observed physical condition.
Installation space, ambient temperature, ventilation, dust, cable-entry and maintenance-access constraints.
Controlled pathway
Combine bills, time-based measurements, load operation and existing-bank information at one defined electrical boundary.
Check load variation, harmonics, possible resonance conditions, low-load states and the practical switching duty.
Evaluate conventional APFC, detuned APFC, fast-switched correction or SVG only against the measured operating need.
Agree the target boundary, accepted operating states and post-installation evidence before treating correction as successful.
Claim boundary
No kvar rating, savings figure, penalty reduction or guaranteed power factor is stated without project-specific measurements and an agreed verification boundary.
Capacitor selection, detuning, switching, discharge, thermal design and protection require detailed engineering for the actual installation.
Questions
A bill can indicate a power-factor concern and monthly demand, but representative load behaviour, system context, harmonics and existing correction details are normally needed for a defensible configuration.
It is considered when measured reactive demand changes rapidly and repeatedly enough that deliberate mechanical steps do not meet the accepted response duty.
No universal rule should be applied from the presence of drives alone. The network, load mix, measurements, resonance screen and capacitor duty need review.