Symptom
Describe what is observed, which equipment is affected, the time pattern, duration and any coincident production or switching event.

A local assessment pathway for teams investigating power factor, harmonic distortion or voltage conditions, structured around measurements and engineering boundaries rather than a predetermined device.
Answer first
A power-quality enquiry should begin with the observed symptom, where and when it occurs, the affected operating state and a map of the electrical system. Measurements are then planned at comparable boundaries before APFC, detuning, AHF, SVG or another action is evaluated.
Terms such as harmonics, voltage fluctuation and poor power factor describe different measurements and can point to different system questions. Starting with a preferred device risks measuring the wrong location or attributing an event to equipment that is only operating at the same time.
The Ahilyanagar pathway organizes the symptom log, single-line diagram, measurement locations and operating-state record. It does not assume that Arnav Industries performed a statutory audit or owns the site data; it describes the evidence needed for a scoped assessment or equipment review.
Decision model
Describe what is observed, which equipment is affected, the time pattern, duration and any coincident production or switching event.
Mark the source, point of common coupling, affected bus and load feeder so each measurement has an unambiguous electrical location.
Synchronize the power-quality record with equipment states, load changes, alarms and switching events on a common time base.
Define the technical or contractual question the investigation must answer before selecting instruments, duration or correction equipment.
A conceptual technical view of the evidence and functional boundary; final project values follow approved engineering.

Final ratings, protection, earthing, settings and interlocks follow approved project engineering.
Open full-size SVGPrepare the review
Begin with whatever is available and label unknowns. A missing input is safer as a visible verification action than as a silent design assumption.
A symptom and event log with dates, times, affected equipment, duration and observed consequence.
Latest available single-line diagram with source, transformer, bus, major loads and correction equipment.
Existing power-quality records including instrument, connection, aggregation, location and operating state.
Major non-linear, cyclic and high-inrush loads with their normal and exceptional operating combinations.
Existing capacitor banks, filters, generators, UPS systems, stabilizers and their operating or alarm history.
Utility or internal acceptance boundary and the engineering decision the measurements are intended to support.
Site access, safe measurement points, shutdown limitations and the person responsible for operating-state annotations.
Controlled pathway
Turn a general complaint into a timestamped symptom with an affected load, duration and coincident operating state.
Use the single-line diagram to identify source, bus and feeder observations that can separate propagation from local load behaviour.
Use suitable methods, time synchronization and representative states so readings from different locations can be interpreted together.
Choose a corrective function only after the condition is supported, then verify the result at the same accepted boundary.
Claim boundary
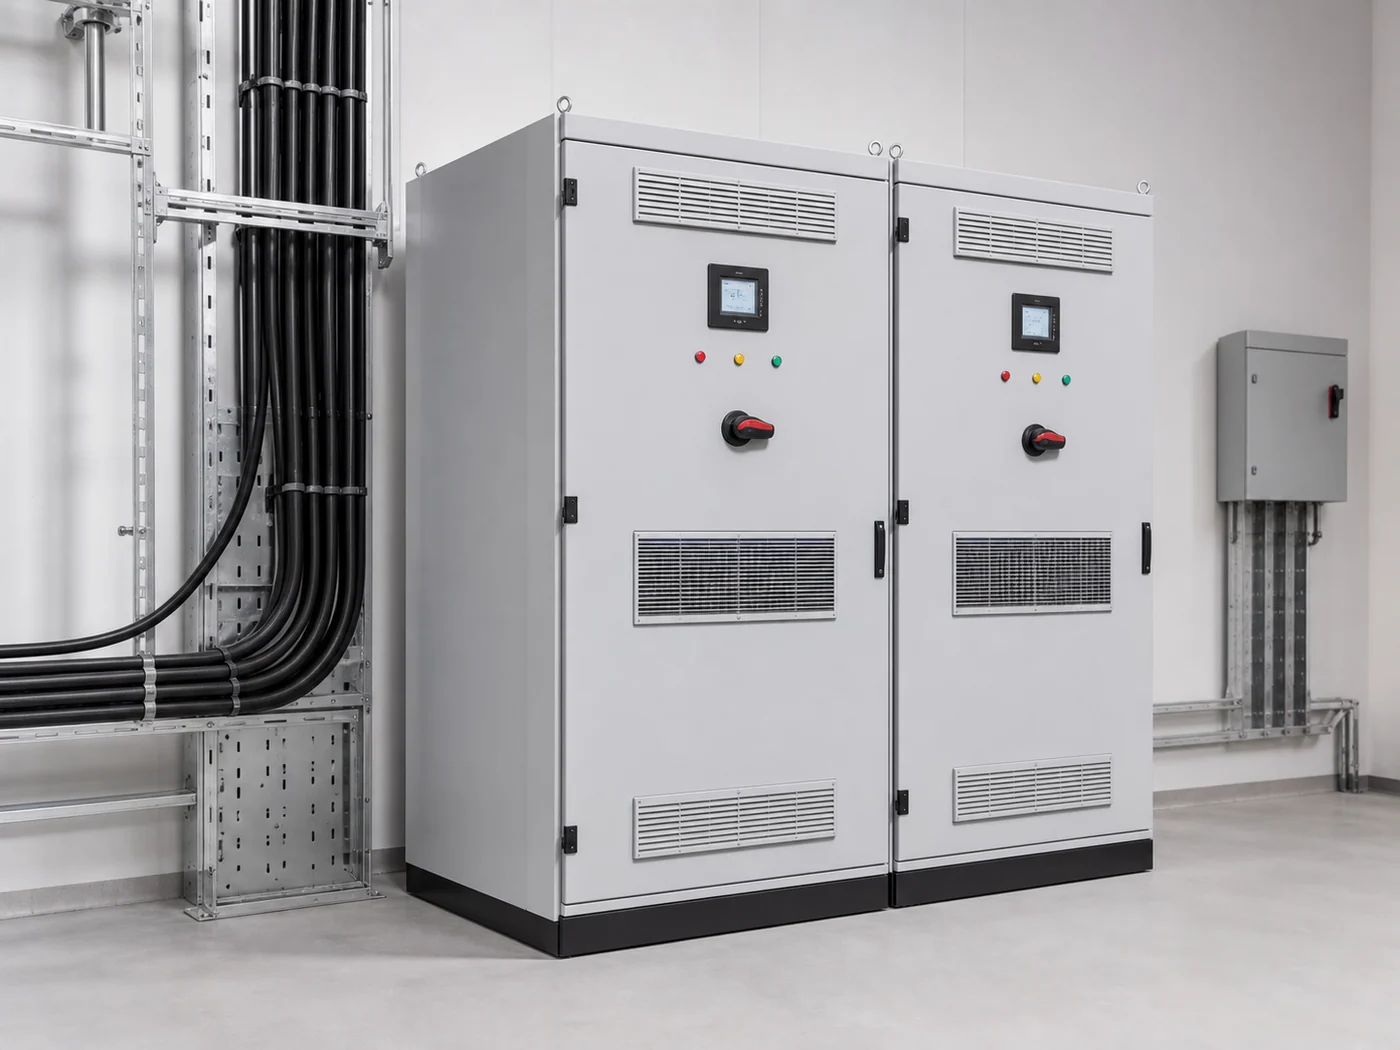
A website cannot diagnose a power-quality cause from symptoms alone, and a product image is not evidence that a particular device is suitable.
Measurement safety, instrument selection, connection method, duration and interpretation belong to a competent project-specific assessment.
Questions
Only when the question and boundary make those measurements relevant. Voltage events, inrush, reactive demand and operating-state correlations can require different evidence.
Sometimes one location shows the condition, but source, affected-bus and load-feeder observations may be needed to distinguish propagation, local emission and system interaction.
No. The spectrum, point of evaluation, source impedance, load states, filter rating and accepted objective need to support that selection.