
A power-quality question is easier to investigate when symptoms are tied to time, equipment operation, measurement locations and the electrical architecture feeding the affected loads.
- A symptom becomes useful evidence when it is tied to time, operating state and measurement location.
- Voltage and current phenomena should be interpreted against the single-line diagram and point of common coupling.
- Measurement class, aggregation and transducer arrangement matter when results support a contractual decision.
Turn the symptom into a testable question
Start with what changed, where it was observed and which operating states reproduce the event.
Record the affected equipment, alarm or failure mode, event duration, first known occurrence and any relation to shift, batch, motor starting, welding, source transfer or utility events. Preserve controller logs and timestamps where possible.
Do not label every interruption, nuisance trip or equipment malfunction as a harmonic problem. Voltage dips, interruption, unbalance, transients, wiring defects, protection behaviour and equipment issues can produce overlapping symptoms.
Turn the symptom into a testable question
Start with what changed, where it was observed and which operating states reproduce the event.

Final ratings, protection, earthing, settings and interlocks follow approved project engineering.
Open full-size SVGChoose locations and operating windows
Measurements must distinguish what enters the facility, what a load emits and what sensitive equipment experiences.
Use the single-line diagram to select the point of common coupling, affected feeder, suspected source and sensitive-load locations. Record CT orientation, voltage reference, instrument configuration and the exact operating equipment for each interval.
The monitoring duration should capture representative normal and problematic states. A repeatable motor-start event may be captured quickly; a process with variable production, source changes or weekly operating cycles can require a longer window.
Choose locations and operating windows
Measurements must distinguish what enters the facility, what a load emits and what sensitive equipment experiences.

Final ratings, protection, earthing, settings and interlocks follow approved project engineering.
Open full-size SVGInterpret results at the correct boundary
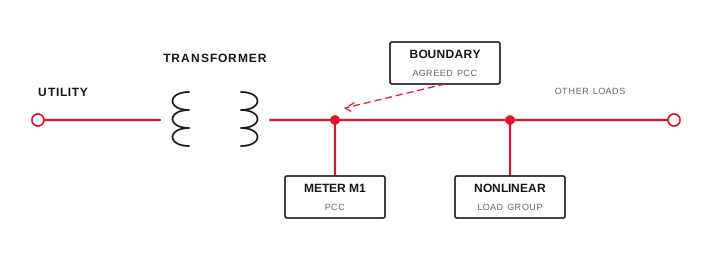
Harmonic and power-quality results have meaning only when the parameter, aggregation and system boundary are explicit.
IEEE 519 frames steady-state harmonic goals at the user point of common coupling, while IEC 61000-4-30 defines repeatable methods for a range of power-quality parameters. An equipment terminal reading and a PCC compliance assessment therefore answer different questions.
Compare events across locations and operating states before selecting a remedy. The useful output is a causal explanation, the evidence supporting it, limitations in the data and the next engineering decision—not only a screenshot of a single index.
| Phenomenon | Useful context | Typical decision |
|---|---|---|
| Voltage dip | Depth, duration, source and load state | Ride-through, source or starting review |
| Harmonics | Spectrum, PCC, demand and operating state | Emission, resonance and filtering review |
| Unbalance | Phase values, load distribution and source | Connection, loading or supply investigation |
| Power factor | kW, kVAr, timing and switching state | Correction rating and control strategy |
Interpret results at the correct boundary
Harmonic and power-quality results have meaning only when the parameter, aggregation and system boundary are explicit.
Final ratings, protection, earthing, settings and interlocks follow approved project engineering.
Open full-size SVGInformation that makes the next review more useful.
- 01
Describe the symptom, affected equipment, first occurrence and any pattern by shift or process state.
- 02
Share the single-line diagram, transformer, generators, UPS systems and major distribution paths.
- 03
List non-linear, rapidly switched, high-starting-current and sensitive loads in the affected area.
- 04
Provide available voltage, current, demand, power-factor and harmonic measurements with timestamps.
- 05
Record where instruments were connected and which equipment was operating during each interval.
- 06
Identify capacitor banks, APFC panels, filters, stabilisers and recent electrical changes.
- 07
State the decision required from the review and any site access or shutdown limitations.
Standards and technical references.
Links identify the source and scope; access to a complete standard may require purchase or organisational access.
- 01IEC 61000-4-30:2025 — Power-quality measurement methodsInternational Electrotechnical Commission
- 02IEEE 519-2022 — Harmonic control in electric power systemsIEEE Standards Association
- 03Central Electricity Authority safety and electric-supply regulations, 2023Central Electricity Authority, Government of India
Questions engineers and project teams ask.
How long should power-quality measurements run?
The duration should capture representative normal and problematic operating states. A short recording may be enough for a repeatable event, while variable production can require longer monitoring.
Should a product be selected before completing the assessment?
Usually not. Similar symptoms can arise from different electrical conditions, so the architecture, measurements and operating context should define whether filtering, correction, conditioning or another response is appropriate.