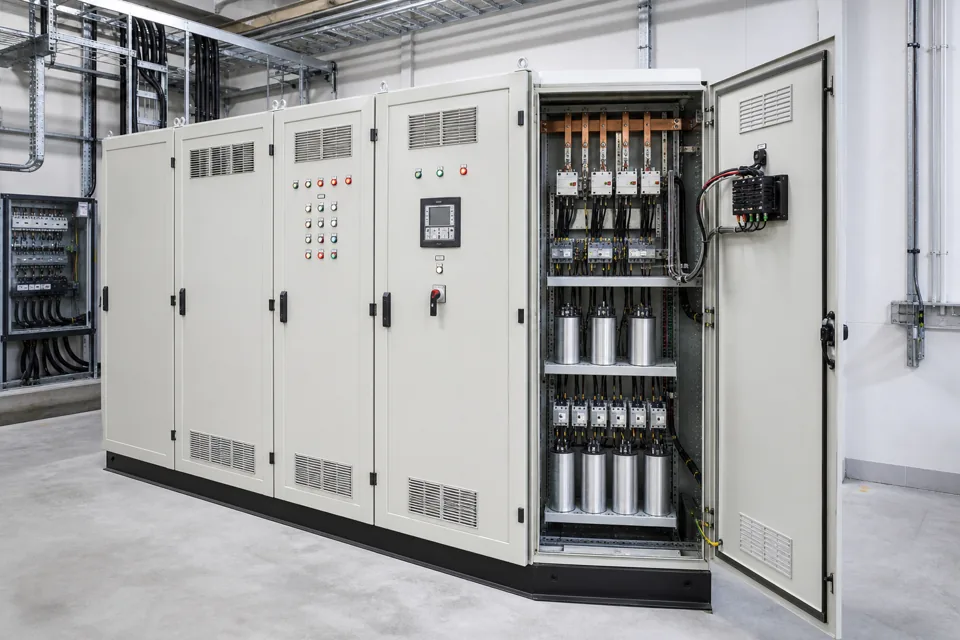
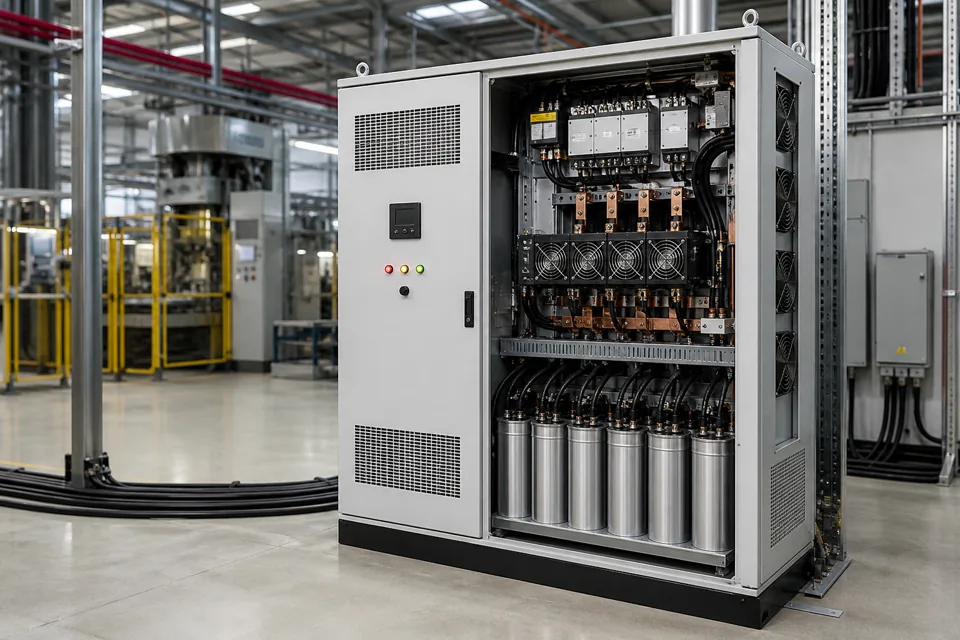
The familiar kVAr correction formula is a useful starting calculation, but an APFC bank still needs time-based load data, stage design and system-condition review.
- Power factor is active power divided by apparent power for the defined measurement condition.
- A common correction estimate is Qc = P × (tan φ1 − tan φ2), with all values tied to one operating state.
- The maximum calculated kVAr should not be installed blindly as one fixed stage.
- Verify light-load behaviour so correction does not become leading when demand falls.
Read the power triangle correctly
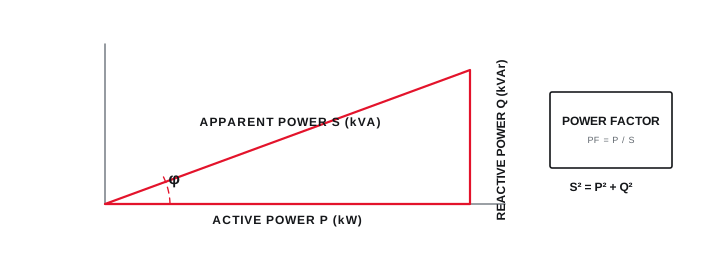
Active power performs useful work, reactive power supports alternating fields, and apparent power represents their vector combination.
For the same measurement interval, apparent power S relates to active power P and reactive power Q through S² = P² + Q². Power factor is P divided by S, while the phase angle φ provides the trigonometric relationship used in correction calculations.
Keep units consistent: kW for active power, kVAr for reactive power and kVA for apparent power. Do not combine a peak kW value with a monthly average power factor and treat the result as one physical operating point.
Read the power triangle correctly
Active power performs useful work, reactive power supports alternating fields, and apparent power represents their vector combination.
Final ratings, protection, earthing, settings and interlocks follow approved project engineering.
Open full-size SVGEstimate correction with the kVAr formula
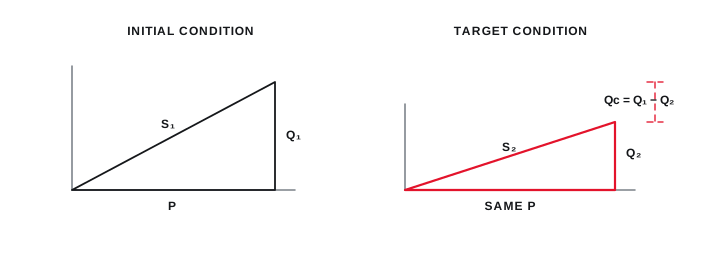
The difference between initial and target reactive demand gives a first estimate for the required capacitive correction at that load point.
For active power P, initial angle φ1 and target angle φ2, the estimated correction is Qc = P × (tan φ1 − tan φ2). The result assumes the active load and power factors describe the same condition and that the target remains lagging unless the project explicitly requires otherwise.
For example, a 300 kW operating point improving from 0.78 to 0.96 uses the corresponding angle tangents to estimate correction. The engineering step that follows is to compare that requirement across time and divide it into suitable automatic stages.
| Item | Calculation role | Engineering check |
|---|---|---|
| Active power P | Scales reactive requirement | Use representative simultaneous demand |
| Initial PF | Defines φ1 | Confirm meter sign and operating state |
| Target PF | Defines φ2 | Avoid an unjustified unity target |
| Qc result | Estimated capacitor kVAr | Split into stages and review harmonics |
Estimate correction with the kVAr formula
The difference between initial and target reactive demand gives a first estimate for the required capacitive correction at that load point.
Final ratings, protection, earthing, settings and interlocks follow approved project engineering.
Open full-size SVGConvert the result into an automatic bank
Stage resolution should cover the operating range without persistent under-correction, leading operation or excessive switching.
Plot calculated reactive requirement across representative intervals. The smallest useful step follows the minimum meaningful change, controller sensitivity and acceptable residual error; larger stages can then build the required range.
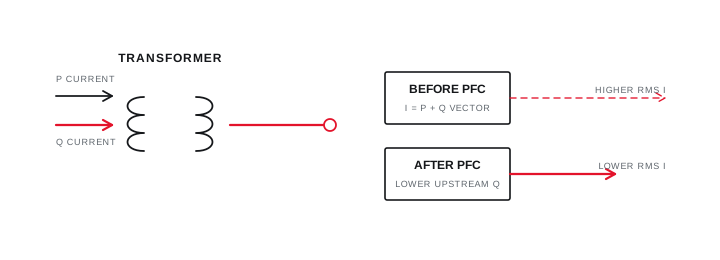
Check transformer and feeder conditions at the proposed connection point. Correction can reduce upstream current for the same active load, but it does not create transformer kW capacity without considering thermal limits, harmonics, voltage and the complete load profile.
Convert the result into an automatic bank
Stage resolution should cover the operating range without persistent under-correction, leading operation or excessive switching.
Final ratings, protection, earthing, settings and interlocks follow approved project engineering.
Open full-size SVGInformation that makes the next review more useful.
- 01
Active power at the same operating point as the measured initial power factor.
- 02
Target power factor agreed against the utility and process objective.
- 03
Operating range rather than only the maximum-load condition.
- 04
System voltage and frequency at the intended connection point.
- 05
Harmonic and resonance review before final capacitor selection.
- 06
Stage ratio, switching method, discharge time and thermal duty.
Standards and technical references.
Links identify the source and scope; access to a complete standard may require purchase or organisational access.
- 01Continuous Energy Improvement in Motor Driven Systems — power-factor correctionUnited States Department of Energy
- 02Technology compendium — Automatic power-factor controllerBureau of Energy Efficiency, Government of India
- 03IEC 61921:2017 — Low-voltage power-factor correction banksInternational Electrotechnical Commission
Questions engineers and project teams ask.
Should the target power factor always be exactly one?
Not automatically. The target should follow the tariff, utility, operating and control objective while retaining margin against leading operation and measurement or load variation.
Can electricity-bill data size the complete APFC panel?
Bills can reveal demand and billing power-factor patterns, but detailed stage and switching design benefits from time-based kW, kVAr, power-factor and harmonic information at the intended connection point.