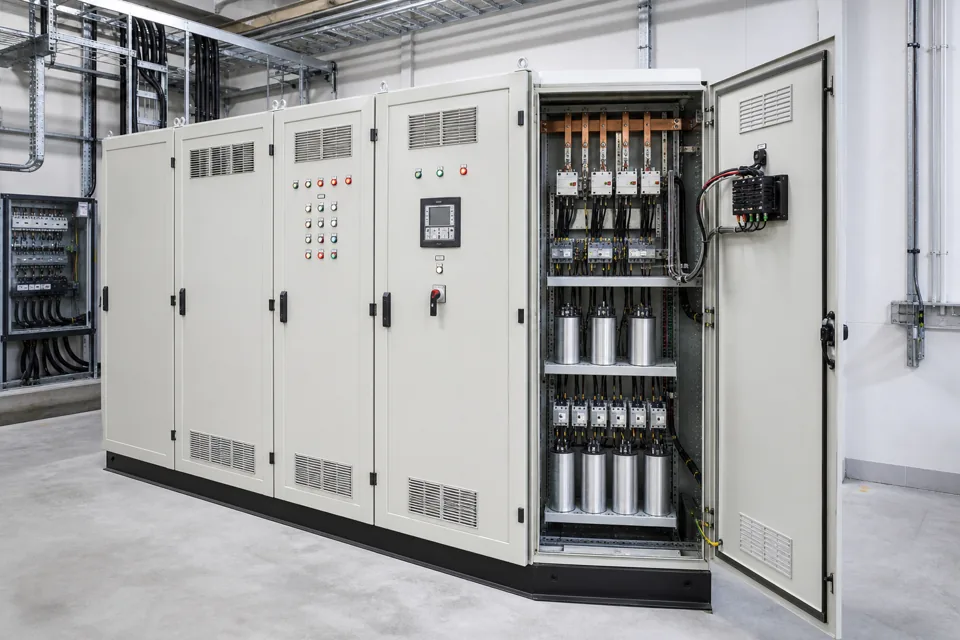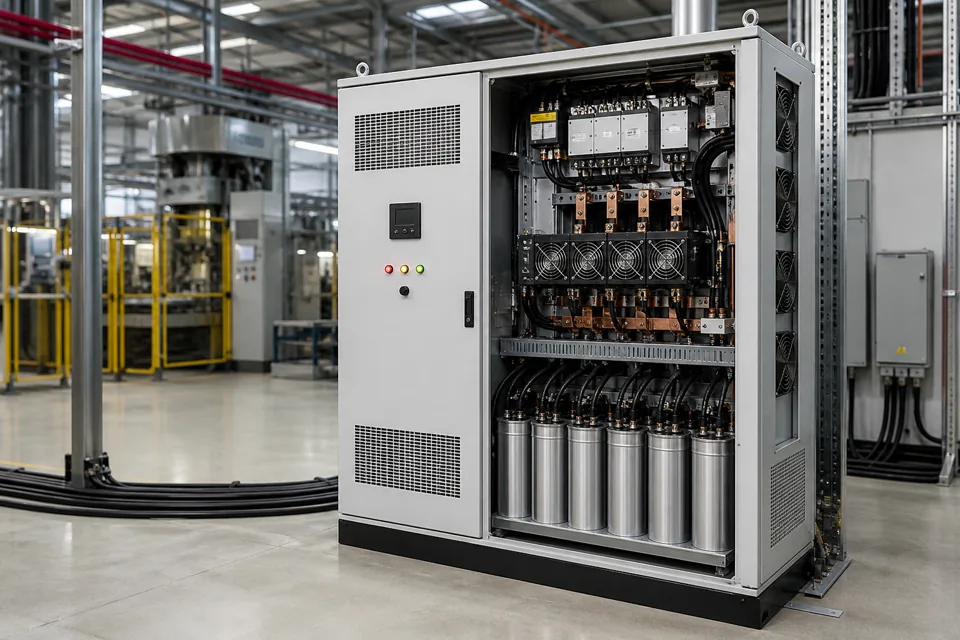

APFC step sizing is a resolution problem: the smallest useful stage, ratio between stages and switching program should follow measured reactive-demand variation without creating hunting or excessive operations.
- Total kVAr does not determine the smallest useful control increment.
- Step ratios must match both the load profile and the controller's supported logic.
- Rotation and deadband are used to manage hunting, overshoot and uneven switching wear.
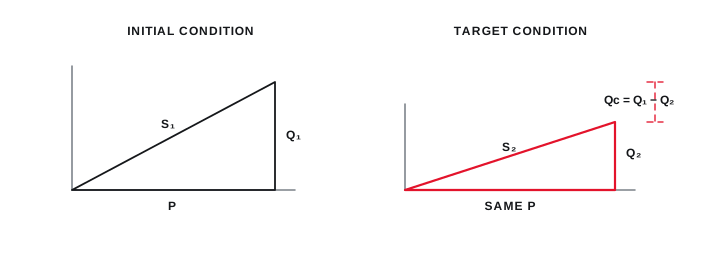
Derive control resolution from the load profile
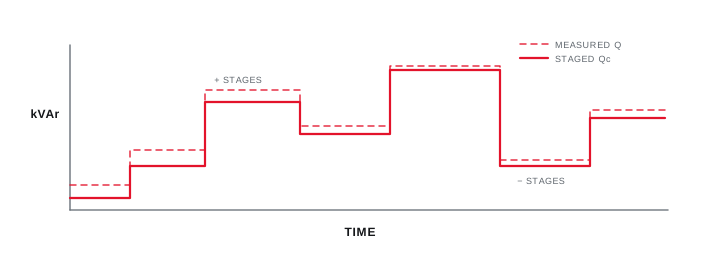
The smallest stage should be meaningful relative to repeated changes in reactive demand, measurement stability and the acceptable power-factor band.
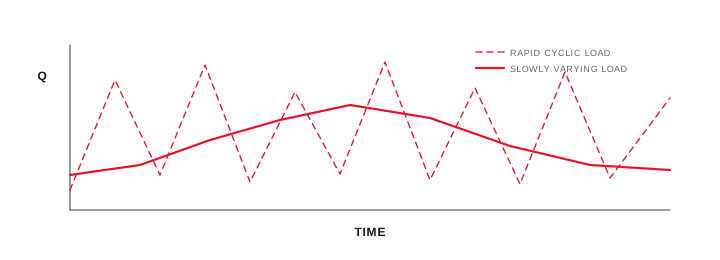
Begin with time-series data rather than one utility-bill average. A bank sized only from maximum kVAr can be coarse at low production, while a bank with very small stages can switch frequently when the measured demand oscillates around thresholds.
Plot stable production states, shift changes, motor cycling and low-load periods. Use those states to test how a proposed stage combination would move the source reactive demand after each command.
Evidence basis[1] International Electrotechnical Commission[2] International Electrotechnical Commission
Derive control resolution from the load profile
The smallest stage should be meaningful relative to repeated changes in reactive demand, measurement stability and the acceptable power-factor band.
Final ratings, protection, earthing, settings and interlocks follow approved project engineering.
Open full-size SVGCompare equal and ratioed step arrangements
Equal steps simplify inventory and control, while ratioed steps can create more combinations when the controller recognises the sequence correctly.
A 1:1:1 arrangement produces the same increment on every command. Ratios such as 1:1:2 or 1:2:4 can produce more aggregate combinations from fewer physical stage sizes, but only when the controller program, actual component values and rotation method support that logic.
Do not treat a theoretical binary combination as proof of practical performance. Minimum on/off times, blocked stages, tolerance, voltage-dependent kVAr and maintenance substitution can change the available combinations.
Evidence basis[1] International Electrotechnical Commission[3] Schneider Electric
| Arrangement | Strength | Review point |
|---|---|---|
| Equal stages | Simple replacement and rotation | May be coarse at low demand |
| Partly ratioed | More aggregate combinations | Controller sequence must match |
| Fine first stage | Improved low-load resolution | Can accumulate switching duty |
| Mixed technology | Separates slow and rapid demand | Requires coordinated controls |
Compare equal and ratioed step arrangements
Equal steps simplify inventory and control, while ratioed steps can create more combinations when the controller recognises the sequence correctly.
Final ratings, protection, earthing, settings and interlocks follow approved project engineering.
Open full-size SVGVerify the switching sequence against real states
A sequence is accepted only after commands, measured response, lockout timing and failed-stage behaviour have been observed under an approved test plan.
Record the stage order, rotation method, target, deadband, delay and minimum off-time. Simulate or observe representative load changes and check that the bank neither crosses repeatedly around the threshold nor remains over-corrected during low-load conditions.
Include an unavailable or failed stage in the review. The controller indication, alarm path and remaining combinations should remain understandable to operations and maintenance personnel.
Evidence basis[1] International Electrotechnical Commission[2] International Electrotechnical Commission[3] Schneider Electric
Verify the switching sequence against real states
A sequence is accepted only after commands, measured response, lockout timing and failed-stage behaviour have been observed under an approved test plan.
Final ratings, protection, earthing, settings and interlocks follow approved project engineering.
Open full-size SVGInformation that makes the next review more useful.
- 01
Export time-based kW, kVAr and power-factor data for representative operating states.
- 02
Separate stable base demand from repetitive, intermittent and rapidly changing demand.
- 03
Confirm total required correction only after checking transformer and load context.
- 04
Choose the smallest step against normal reactive-demand increments and control deadband.
- 05
Check that the controller supports the proposed step ratio and rotation program.
- 06
Estimate operations per stage and include minimum on/off timing.
- 07
Verify final stage values at actual voltage and with component tolerances.
Standards and technical references.
Links identify the source and scope; access to a complete standard may require purchase or organisational access.
Questions engineers and project teams ask.
Should every APFC capacitor stage have the same kVAr rating?
Not necessarily. Equal stages are straightforward, while ratioed stages can offer more resolution. The choice must match measured demand, controller logic, switching duty and maintenance strategy.
Why does an APFC bank hunt between two steps?
Possible causes include coarse step size, narrow deadband, unstable measurement, short delays, incorrect CT signals or a rapidly varying load. The trend and settings should be reviewed together.